
Key Points
o Gold prices have a strong, inversely correlated relationship to 10-year yields (the post-1990s regime) - low rates and longer-dated yields are likely here to stay; 2
o Gold’s post-1990 relationship with the dollar is far weaker than the 10-year’s;
o Gold is a desirable non-Treasury store of dollar value, so it will remain generally well-bid as non-U.S. central banks and many others look to accumulate rainy-day protection and diversify away from U.S. Treasuries; 3
▪ Gold prices will remain volatile as emerging market (EM) central banks often sell when they experience capital outflows and must protect local currencies;
o HYMC trades at significant discount to Au equivalent NPV5% versus peers, and thus, provides significant downside protection at current gold prices with substantial upside optionality even without a rise in gold price;
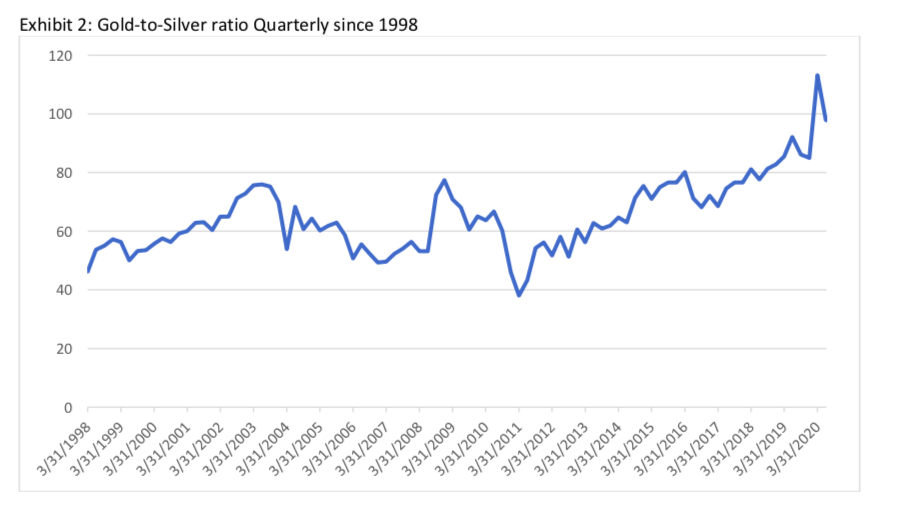
o HYMC’s proven silver reserves are a kicker with the gold-to-silver ratio at all-time highs.
Overview
Traditionally, market participants have regarded gold as an inflation hedge. Alternatively, they’ve regarded it as a flight-to-safety asset. Empirically, over the past 20 years, the first two justifications for gold’s value appear to have failed.4 Somewhat less frequently, emphasis is placed on gold’s scarcity value. Because it is in fact a non-perishable commodity, seldom can one ascertain its price based on traditional perishable commodity supply-demand analysis. Overall, gold more-often-than-not appears to serve best as a ‘store of dollar liquidity.’ As market participants’ appetite for a U.S. Treasury substitutes grows, gold appears to appreciate. Ironically, it is the need for dollar liquidity rather than a rejection of the dollar itself that makes gold (a dollar denominated asset) most appealing.
Because gold competes against Treasuries as a store of dollar value, price performance appears to be most directly and persistently influenced by its relationship to developed market sovereign rates - especially longer-dated yields in the U.S.5 Since the late 1990s, as rates and longer-dated yields have fallen, gold prices have tended to rise. This was particularly true under zero interest rate policy (ZIRP) and while term premia suppression lowered long-rates to near zero (post-GFC). The data suggest that gold may in fact appreciate during periods of disinflation (post-1990s) as well as during periods of inflation (pre-1990s), but its relationship to both is coincident to its role as a Treasury substitute. As a Treasury substitute it acts as a dollar reserve asset without associated credit, duration or convexity risk. It is an asset without a dollar-based contra-liability.6
Qualitatively and conceptually, there is good reason to desire gold ownership now more than any time in recent memory. The Fed, in particular, has printed itself into a corner relative to balance sheet normalization, and recent experience with normalization ended in failure. 7 The Fed and other central banks’ debt monetization programs have already destroyed free market price discovery – particularly in rates markets. 8 Does not the need to monetize deficits suggest that the U.S. is unable to fund its expenditures by traditional means (tax and spend)? Monetization is necessary now as U.S. deficits are rising above $3 trillion annually. Our fiat system and its liabilities are now wounded, and the Fed and other central banks are nearing the limits of their powers.9 Gold potentially transcends them.
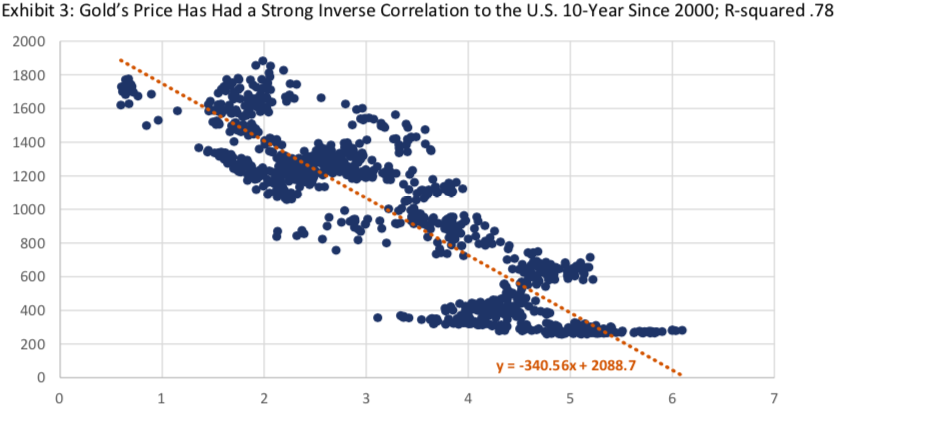
Unfortunately, quantitative analysis will not provide a satisfying answer about the near-term trajectory of the price of gold, but it seems to suggest that gold is about fairly valued at $1,750 to 1,800/oz. (Exhibit 3 of the Appendix). While this analysis suggests that gold is in-line with its predicted regression relationship to 10-year yields, gold tends to run above and below the model ‘prediction’ most of the time. Apart from outright gold ownership, there appears to be an interesting way to express the view (as here) that gold is an attractive asset to own at its current price. Common equity in the U.S.’s second largest gold and silver resource – Hycroft Mining (HYMC ~$10) – may provide an investor with asymmetric upside exposure to gold (and silver).
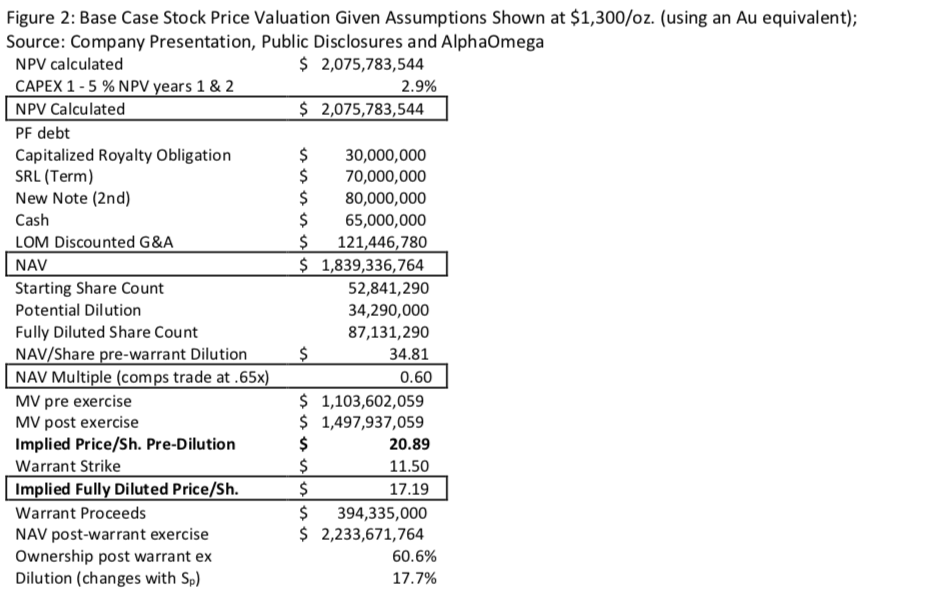
The firm’s feasibility study assessed average gold production of roughly 366,000 ounces annually.10 Proven and probable reserves are about 1.133 million tons. The company determined its NPV5% using gold at $1,300/oz. At just over $9/share, the company trades below .25x NPV5% versus comparable companies that trade at about .65x NPV5%.Using the comparable multiple to NPV5% of .65x, a gold price of $1,300/oz., and accounting for warrant dilution, the company’s share price might be ~$18. At $1,700/oz. and using a comparable company NPV5% multiple, the stock price might be ~$31. Perhaps most importantly, the discounted valuation appears to protect an investors downside to about $1,200/ounce (a .35x multiple to NPV5%).
A Flight-to-Safety Asset
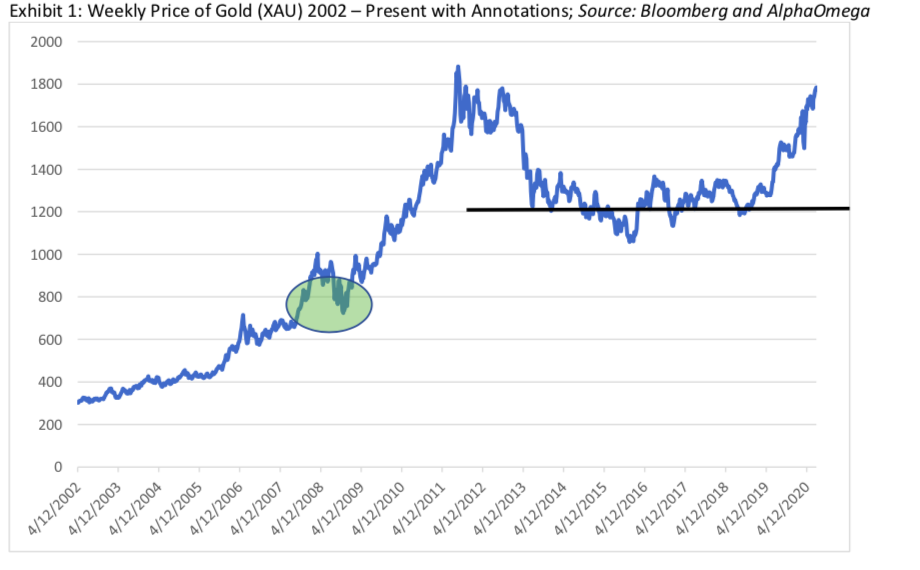
Since 1998, despite perception and persistent narrative, gold has served relatively poorly as a flight-to- safety asset. As a risk hedge in 2001 and 2008, gold prices fell when stresses were most severe (green circle in Exhibit 1). In 2008, the need for dollar liquidity led market participants to sell their gold stores. In subsequent years (2010 – 2013) and once the extreme stress had abated, gold’s price appreciated once again. Market participants apparently looked to rebuild stores for the next rainy day. In March 2020, a similar dynamic occurred as gold briefly came for sale as a source of dollar liquidity, but it recovered much more quickly - most recently approaching 2012 highs. In fact, contrary to the common narrative, the flight to safety in gold does not occur during times of stress. Rather, it occurs after times of stress, as central banks and other market participants accumulate gold in order to try to avoid dollar liquidity shortfalls during the next crisis!
A Scarce Commodity
Gold rarely behaves like a perishable commodity, but it has never stopped analysts from talking about jewelry demand and mine output as price drivers. Gold supply and demand statistics are readily available on Goldhub and elsewhere.11 For 2019, the Goldhub data show total gold demand – including demand from central banks and ‘investments’ (reported ETFs et al.) at 4,366 tonnes. Supply was reportedly 4,811 tonnes for 2019. Despite the demand shortfall, gold appreciated roughly 21% in 2019. While jewelry demand, in particular, has a clear seasonal impact on gold prices (at 52% of 2019 annual demand), it is not the long-term price driver. Gold’s scarcity, too, matters greatly as a baseline for supply. As a non-perishable asset, mine and recycling supply versus use demand dynamics are far less important than for an industrial commodity.
The key driver of demand ‘delta’ comes from investment, which is notoriously difficult to track. Refinitiv’s GFMS team conducts traditional global supply-demand analysis. (It is part of the input for GoldHub’s supply-demand analysis). Like the GoldHub data, the GFMS and WGC data are helpful to understanding the supply-demand picture, but the data do not satisfactorily account for financial or investment flows. GFMS’s statement about investment demand is perhaps as opaque as the data itself:
“Gold is also widely used as an investment, however, where physical flows to and from the market can be monitored, to a degree. As such we include the highly visible net-ETF inventory build and also published changes at gold held by futures exchanges. This gives a partial indication of the flow of physical gold from above ground stocks and our net balance for the market. It should be noted, however, that ETF and exchange inventory flows account for only a small percentage of the opaque Over the Counter market [institutional supply and demand].”
The gold-to-silver ratio is often cited as a reason to own one commodity or the other based upon some concept of reversion towards a mean of that ratio. What seems to be true is that the ratio has been increasing over time. Indeed, it appears that the ratio has increased steadily since just after the financial crisis and now sits at an all-time high (since 1998 at ~97). See Exhibit 2 of the Appendix. One big difference between gold and silver is that over half of silver’s demand comes from industrial use while gold is only about 7%.12 Certainly, it seems tenuous to argue that the silver market will dictate gold prices. If anything, it might be more plausible to believe gold will drag silver prices higher as low longer-dated Treasury yields keep gold well bid and as market participants look for a substitute for ever more expensive gold. In the end, gold’s scarcity is critically important to its use as a financial asset, but traditional perishable supply-demand dynamics need not apply.
A Store of Dollar Value
Gold serves most often as an alternative store of dollar value, which explains its performance in both inflationary and deflationary environments. So far, gold’s roles as a flight-to-safety asset and a perishable commodity appear unsatisfying explanations about why one ought to own gold now. While gold rose with long-dated yields in the 1970s, that changed completely after the 1990s ended.13 In order to understand gold’s current behavior, the post-1990s period continues to apply. Since the late 1990s, lower global sovereign yields – which tend to exist in disinflationary environments – have correlated well with higher gold prices. When looking at a twenty-year regression against the 10-year Treasury (Exhibit 3 of the Appendix) and even the Bund14 (not shown), R-squareds are above 75 for both regressions.15 While the regression does not suggest that gold is significantly ‘undervalued’ relative to the 10-year Treasury, it does suggest that gold is about fairly valued at $1,750 to 1,800/oz. versus the 10-year yield.
In contrast to the most recent twenty years, long-rates trended higher in the 1970s.16 For a time, they rose because inflation was accelerating. Gold, too, rose in price. Eventually the Volker Fed was forced to hike. There was something else going on, though. The U.S. government had been fixing the price of gold at $35 per ounce price until August 15, 1971, when President Richard Nixon announced that the United States would no longer convert dollars to gold at a fixed value - abandoning the gold standard. Gold began to rally almost immediately thereafter. The price appreciation in gold from 1971 to late 1973 could be attributed to gold finding its market price after prolonged repression. Of course, a stagflationary shock was about to follow in the fall of 1974: the oil embargo. Gold rallied hard only to peak at almost $700/oz. in late 1980 as both long-dated yields and inflation peaked.
Perhaps counterintuitively since the late 1990s, it seems that gold has actually performed quite well in deflationary or disinflationary environments, in which Treasury yields tend to remain low.17 Gold’s strong post-1990s relationship to long-rates may have several explanations, but they all revert to its role as a Treasury substitute. For one, gold is a way to store value in the dollar without owning U.S. Treasuries or any obligation of a foreign or domestic sovereign. Said differently, the opportunity cost of owning gold is lower (or even positive) when rates are low (or negative). One thing seems relatively clear in this murky world, developed market central banks are stuck in a Cycle of Addiction. Low sovereign yields are here to stay by economic and market necessity. If true, it would seem gold should maintain support from low rates. But, what of the pre-1990s period when gold rose with rates (and at times fell with them)?
Given its relationship to the 10-year yield and inflation throughout the 1970s, it’s important to ask why, over the past twenty years, gold’s relationship with 10-year yields has been so different. Interestingly, gold may have behaved very differently versus the direction of rates during both the pre- 1990s regime and the post-1990s regime for the same reason. During times of accelerating inflation (like the 1970s), investors fear more of it (inflation) and the higher yields that follow. Near the zero bound (like much of the time post-GFC), they simply fear that rates and yields can go nowhere but up. In both cases, market participants look for an alternative to Treasuries as a store of dollar value. Treasury investors may buy gold to avoid Treasury duration risk - gold can be instantly converted into dollars and has no associated cash flows (i.e. – no Macauley duration, a frequent knock by critics of gold ownership).
Both now and then, gold provided an alternative to Treasury ownership. While inflation may have been the driver of market participants’ fear of higher yields during the pre-1990s regime, now it is other factors. The recent failure of the Fed to mange balance sheet normalization without a rates market dislocation (initially in repo markets) may be calling its ability to manage rates markets into question. This fear is likely being amplified by massive fiscal policy deficits, which the Fed has now been required to monetize – perhaps indefinitely. Perhaps most importantly, with yields near zero across the U.S. Treasury curve, the risk of higher yields (or at least not much lower) is immense and asymmetric. Moreover, convexity risk is higher at lower yields. For pension funds and central banks not wishing to take that risk... there’s gold.
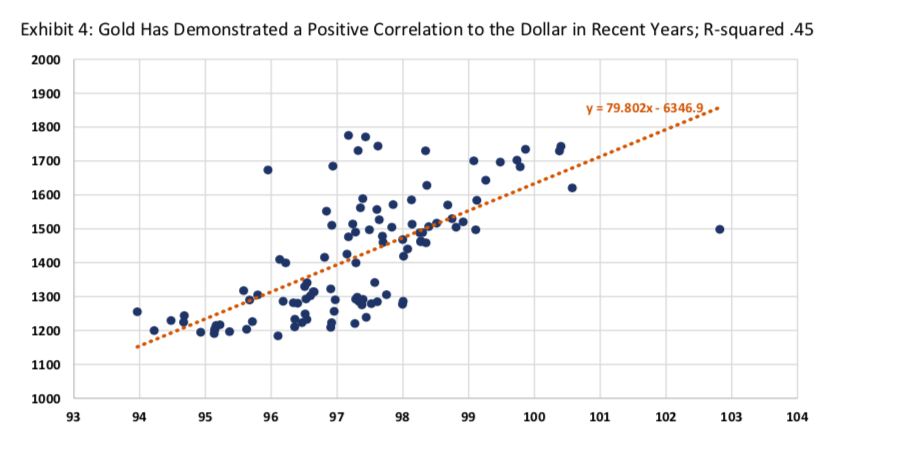
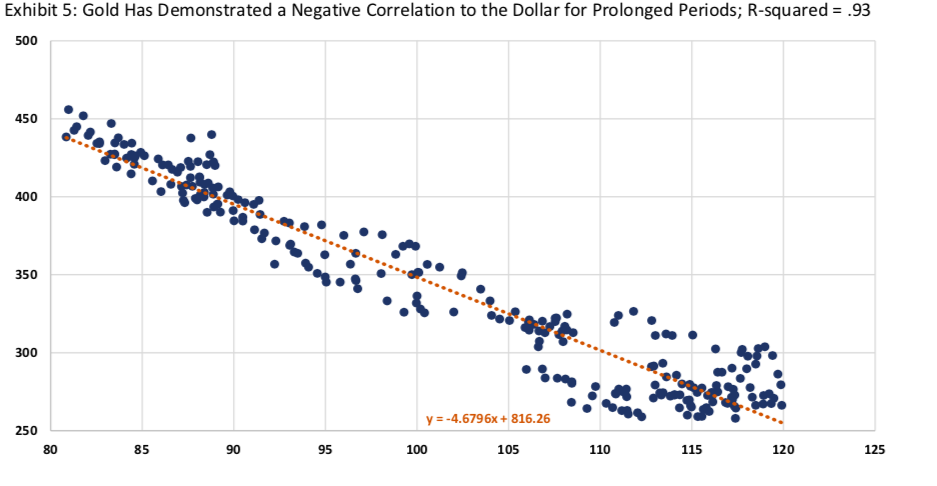
During the post-1990s period, the correlation between gold and the dollar has fluctuated far more often than the relationship of gold to the 10-year yield. Within the same long-term regression time frame (2000 – 2020), several mini-regime shifts occur. In recent years (2018 – present), gold has rallied alongside the dollar (Exhibit 4 of the Appendix). The regression demonstrates a significantly positive correlation. From 2000 to 2005, gold spent years inversely correlated to the dollar (Exhibit 5 of the Appendix). Especially in EMs, gold often moves hand-in-hand with local currency performance as central banks accumulate rainy-day insurance when local currencies are strong relative to the dollar.18
In sum, gold’s relationship to the dollar seems far less explanatory over the long-run than its relationship to yields.
Gold is not the anti-dollar. There remains a global, structural shortage of dollars. The currency ‘basis’ market and the propensity for non-US banks to use the Fed’s dollar swap lines, demonstrate the global reliance on dollars. Moreover, of late, rate differentials have been driving the dollar’s move more than balances of trade. For many of the major crosses, there remains a slight preference for dollar-based sovereign bond ownership – even when currency hedges are considered. Both structural needs and differentials support Treasury ownership, but some global market participants may not desire to own Treasuries. What’s left? Gold. So, the argument here is not that gold is desirable because the dollar will collapse on the heels of Fed debasement.19 To the contrary, it is desirable because the dollar is yet unavoidable, and gold provides a dollar value store without the U.S. contra-party liability.
If ever there was a time to consider gold, it’s now. Fiat currencies are under siege as central banks experiment with ways to escape the global deflationary spiral caused by a suppression of long-rates by developed market central banks. The U.S. is running massive deficits that would, in the absence of monetization, lead to higher Treasury yields. In the second week of March 2020 and just prior to the Fed’s emergency meeting on March 15th, the 10-year yield rose from 35bps at its then recent low to 120bps. This dislocation occurred because even Treasuries came for sale (along with gold) as a source of liquidity. It also may have occurred as investors realized that the pandemic would require even more massive deficits to combat – especially in a world where monetary policy had already been largely exhausted. Those deficits require more Treasury issuance.
Will the Fed ever end its monetization program? In light of the need for continued deficits, gold is one way to hedge a second failed attempt to normalize policy (i.e. – a situation in which yields rise). This risk is a threat to the credibility of Treasuries as a store of dollar value; thus, Treasuries may no longer be the preferred store of dollar value. Gold’s post-1990s relationship to 10-year yields (as opposed to shorter-dated yields) appears to provide the best guidepost for gold’s price. The regression to yields shows that even a 2-standard deviation move would mean that gold would still not move below ~$1,200/ounce, and at $1,750 – 1,800/oz. its roughly in line with the model prediction versus the U.S. 10-year yield. Apart from a bet directly on gold, there is an undervalued and ‘un-prospected’ (by investors, at least) gold miner that may also present an asymmetric way to express a view on gold.
Hycroft Mining (HYMC): Asymmetric Risk-Reward
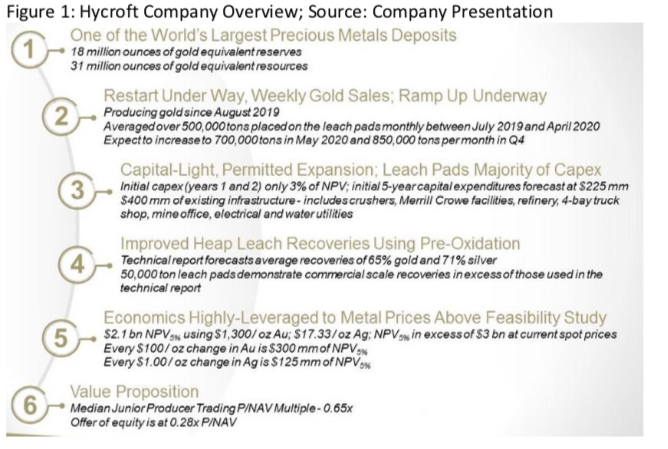
Ownership of one producer in particular might be somewhat akin to selling a put option on gold at just below $1,100/oz. and buying an out-of-the-money call, but that risk reversal is an expensive strategy when considering roll costs. While an investment in Hycroft equity introduces company execution risk, it also introduces desired duration. At the stock’s current price, it ultimately embeds a more cost- effective option on gold than buying a risk reversal. Hycroft contains North America's second largest gold and silver resource. Located in Nevada, the company recently restarted operations and went public. According to the company, it has one of the world’s largest deposits with ~ 31 Moz Au equivalent in the ground and with proven and probable reserves of ~18 Moz Au equivalent. Company highlights may be found in Figure 1.20 With gold well below current prices, one might still conclude that there is significant upside to the current share price.
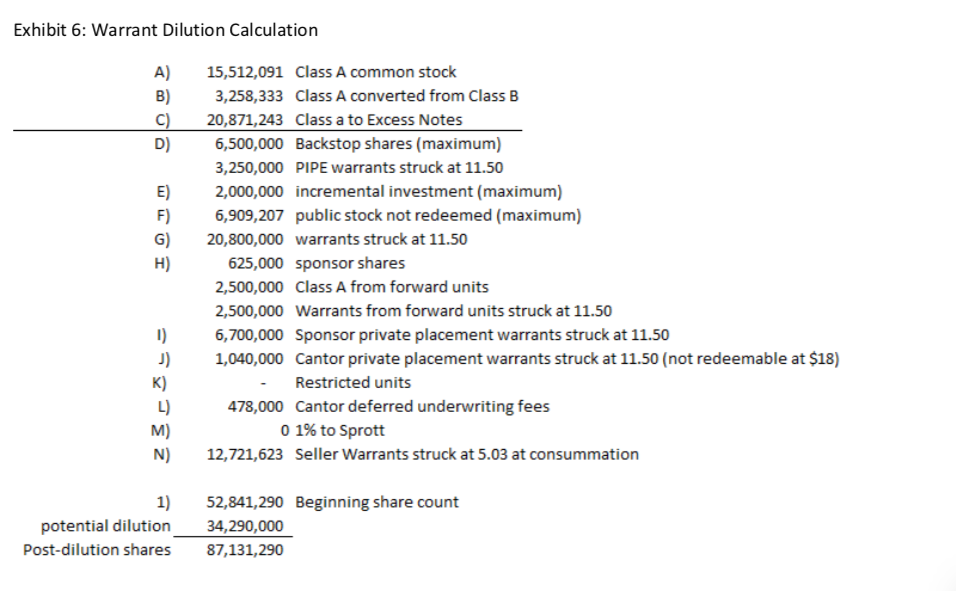
Right now, company shares (HYMC $9.17) trade at approximately .25 times the company’s NPV5% versus peers trading at ~.65x that same metric. It’s relatively high cost of production may be one reason it trades at a discount to peers, but this higher cost is somewhat offset by the fact that it is located in a low-risk jurisdiction. Despite being relatively high cost, there’s plenty of cushion to breakeven. At the feasibility study’s $1,300/oz. gold price, gold was about 50% higher than the all-in cost to breakeven. Significant warrant dilution, which is due to the fact that the company went public through a blank-check company (or SPAC vehicle), may also be weighing on shares. Exhibit 6 of the Appendix shows an estimate of warrant dilution based on the public offering documents.
The process of reconstructing the company’s NPV5% calculation, unsurprisingly shows that the biggest risks appear to be meeting the company’s goal of a CAPEX-light restart coupled with the ability to meet production targets. These goals are clearly related. Fortunately, even if the company should not fully execute on its production targets, there is significant cushion built into the stock’s price. The table presented in Figure 2 below shows the waterfall of value from a de novo estimate of the company’s NPV5%, which appears roughly equivalent to the company’s estimate (albeit AlphaOmega estimates about $81 million higher at $2.075 billion versus $1.994 million).
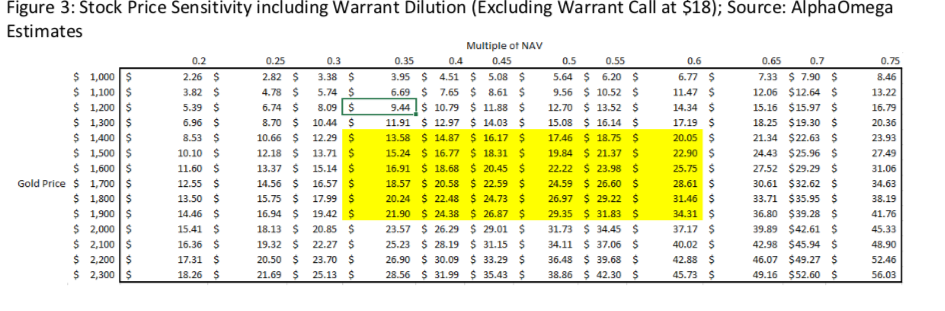
The sensitivity table illustrates that even with a slight discount to peers (at .60x NPV5%), the company’s stock price – assuming the same $1,300/ounce used in the feasibility study – is roughly $17. Figure 3 shows both a sensitivity to gold prices and NPV5% multiples. All analysis takes into account warrant dilution, but it does not adjust for the callability at $18/share, which would enhance share value estimates above $18. At current gold prices and a comparable multiple of .65x, this sensitivity suggests the stock could trade closer to $30/share.
Conclusion
Sometimes, the accepted narratives around what market participants perceive as the driver of an asset’s value simply don’t prove true when tested empirically (often due to causal attribution error). Given the current environment, that seems true of gold. Right now, monetary policy and its suppression of rates and term premia appear to be driving flows into gold. Near the zero bound, convexity risk is higher and the risk of higher long-yields is massively skewed. Gold is one of the very few alternatives to Treasuries – and with massive deficits, the Bill markets have proven less ‘safe’ than they’ve ordinarily been (i.e. – repo market dislocation). Gold allows market participants to transform Treasury duration and substitute a dollar asset for one without a U.S. Treasury contra-liability.
Thus, gold turns out to be both and inflation ‘hedge’ and a deflation ‘hedge’. During times of accelerating inflation (like the 1970s), investors fear more of it (inflation) and the higher yields that follow. Near the zero bound (like much of the time post-GFC), they simply fear that rates and yields can go nowhere but up. Ironically, gold is an asset with an infinite life (more or less) but it has no Macauley duration (no cash flows), and it is instantly convertible to dollars... making it equivalent to cash. Like a federal reserve note (FRN) or cash, it has no duration. But there is a big difference between cash and gold. Even FRNs have a contra liability residing with a U.S. Treasury now presiding over $3 trillion dollar deficits. Unlike gold, FRNs are not a scarce asset. Coupled with its long history as a currency, gold’s scarcity lends it to price appreciation.
In order to express a constructive view on gold, an investor or market participant could simply buy gold bars, the GLD ETF or even engage in more complicated options strategies. However, Hycroft may provide a more favorable risk-reward proposition. As an unknown producer whose story has yet to be told, Hycroft’s share price may be poised to appreciate in value. Importantly, new gold supply does not appear to significantly influence the price of gold, so a new production ramp like Hycroft should matter little. The stock price’s significant undervaluation may create a margin of safety down to about $1,100/oz. on gold prices.
THIS IS NOT INVESTMENT ADVICE. PLEASE CONSULT YOUR FINANCIAL ADVISOR BEFORE MAKING CHANGES TO YOUR PORTFOLIO.
Notes
1 Convexity risk is higher at lower yields and is more applicable to the current environment than to the 1970s, for example. Near the zero-bound and with virtually no term premia embedded in the U.S. Treasury curve, convexity risk to the 10-year is higher than at higher absolute yields.
2 Interestingly, when running regression analysis on the post-1990s period, 10-year yields have the strongest correlation to gold while 2-year yields and 3-month Bill yields have progressively weaker relationships.
3 Market participants may also diversify away from Treasuries for unrelated geopolitical reasons, as Russia did in 2018.
4 Before the birth of modern monetary policy in the late 1990s, which has brought an unabated suppression of short-rates and eventually of term premia, gold did demonstrate value as an ‘inflation hedge,’ especially during the 1970s. However, as this report will argue, this relationship to inflation in the 1970’s and 1980’s was coincident to its role as a Treasury substitute.
5 The strongly negative correlation between gold and JGB or Bund yields is a product of the fact that yields in Europe and Japan have helped to anchor U.S. Treasury yields. So, gold is not being substituted for those sovereign securities, but it is indirectly correlated to them because of their influence on U.S. long-rates.
6 Thanks to Brunello Rosa of Rosa & Roubini, a former central banker, for this pithy characterization.
7 Recall that normalization in September 2019 resulted in a repo market dislocation and reserve balances well below target. The dislocation in coupon markets in March is likely what led the Fed to its emergency meeting on March 15th.
8 Some might point to Japan and say that there has not yet been a systemic collapse there. Progress towards such a collapse often feels glacial until the glacier suddenly splits in two. Consider somebody driving at 100mph on the freeway. They may make it home 19 times, but their chances of making it home safely the 20th are still much lower. Just because they haven’t met their fate yet doesn’t mean they aren’t more likely to do so.
9 I have written extensively on the use of Section 13(3) to justify the Fed’s purchases of corporate bonds. Exigent Circumstances discusses how the Fed has stretched the limits of its authority. Exigent circumstances are typically a temporary rationale for the government to perform an act that would otherwise be constitutionally impermissible.
10 http://www.hycroftmining.com/wp-content/uploads/Presentation-May-2020.pdf. This presentation contains a good deal of the discussion and data alongside the company’s equity offering documents, 10Qs and 10Ks.
11 https://www.gold.org/goldhub/data/gold-supply-and-demand-statistics
12 https://www.statista.com/statistics/299609/gold-demand-by-industry-sector-share/
13 The closest thing to a mini-regime shift within the post-1990s period occurred during 2002 – 2004. (Even then, there was still a reasonably strong relationship between higher gold prices and rate levels). Thereafter, gold quickly reverted to its longer-term relationship to the US 10-year.
14 It’s important to see the relationship to the Bund because that shows that this is not a function of the dollar versus the Euro.
15 Moreover, during the post-1990s period, it’s informative that shorter-dated Treasuries have weaker relationships with gold than the 10-year. Both adjusted betas and R-squareds are lower for the 2-year and for 3-months Bills with R-squareds at .51 and .31, respectively. The shortest duration Treasury asset would be federal reserve notes or FRNs (cash denominated in dollars). This rates regression exercise is part of the progression that leads to the conclusion that gold’s relationship to the dollar is weak in the post-1990s experience.
16 Unlike recent history, when looking at a regression of gold versus 10-year yields from 1970 to 1980, the R-squared is .80 and the correlation is positively sloped. This regime is dubbed the ‘pre-1990s.’
17 Inflation is no longer a Phillips curve phenomenon. It's seems clear that academic models don't effectively take the impact of QE on long-dated rates and the consequent effect on investment decisions into account. Monetary policy has largely been considered a demand-side phenomenon, but QE changed that. Indeed, QE may not be inflationary; rather, perhaps it's just the opposite. Term structure suppression (in particular) leads to over-investment. Over investment leads to overcapacity. Overcapacity makes price harder to achieve. No pricing power... no inflation. It doesn't work that way for all goods or services, of course, so there's also a bifurcation going on in inflation. In short, the old way of thinking about inflation is broken. It’s not a Philips curve world any more.
18 The flip side of this is that gold may come for sale when EM currencies are stressed. We can see an interesting example when looking at the Indonesian Rupiah versus gold from mid-2013 through mid-2016. Indonesian GDP growth began decelerating in 2011 (from 6.5% to below 5% by 2015) and the currency followed.
19 Monetary policy does not work through the ‘quantity of money.’ Rather it works through rates and spreads – both of which have been suppressed to the detriment of price discovery in risk-asset markets. “More dollars in the system” from monetary authorities is NOT what leads to inflation.
20 http://www.hycroftmining.com/wp-content/uploads/Presentation-May-2020.pdf. Much of the information in this report is based on this presentation as well as other company filings and public disclosures.
AlphaOmega Advisors, LLC (AOA) does not conduct “investment research” as defined in the FCA Conduct of Business Sourcebook (COBS) section 12 nor does AOA provide “advice about securities” as defined in the Regulation of Investment Advisors by the U.S. SEC. AOA is not regulated by the SEC or by the FCA or by any other regulatory body. Nothing in this email or any attachment to it shall be deemed to constitute financial or other professional advice, and under no circumstances shall AOA be liable for any direct or indirect losses, costs or expenses that results from the content of this email or any attachment to it. AOA has an internal policy designed to minimize the risk of receiving or misusing confidential or potentially material non-public information. The views and conclusions expressed here may be changed without notice. AOA, its partners and employees make no representation about the completeness or accuracy of the data, calculations, information or opinions included in or attached to this email, is based on information received or developed by AOA as of the date hereof, and AOA shall be under no obligation to provide any notice if such data, calculations, information or opinions expressed in this email or any attachment to it changes. Any such research may not be copied, redistributed, or reproduced in part or whole without AOA’s express written permission. The prices of securities referred to in any research is based on pricing as of the date the research was conducted, may rise or fall at any time thereafter, and past performance and forecasts should not be treated as a reliable indicator of future performance or results. This email and any attachment to it is not directed to you if AOA is barred from doing so in your jurisdiction. This email and any attachment to it is for informational purposes only and does not constitute an offer or solicitation to buy or sell securities or to enter into any investment transaction or use any investment service. AOA is not affiliated with any U.S. or foreign broker dealer. AOA or its principals may own securities discussed herein.


Subscribe to our evening newsletter to stay informed during these challenging times!!


[…] post CHECK IN With CECCHINI (@CecchiniPeter) An Aura Of Treasure…Gold And An Undiscovered Miner In… appeared first on CD […]
[…] CHECK IN With CECCHINI (@CecchiniPeter) An Aura Of Treasure…Gold And An Undiscovered Miner In… […]
lol u r kidding, amirite?