CDMedia does not give investment advice. Please make sure you talk to your financial advisor before making any changes to your portfolio.
Preface
Tyler Fitzgerald (Jim Backus aka Thurston Howell III from Gilligan’s Island): Anybody can fly a plane, now here: I'll check you out. Put your little hands on the wheel there. Now put your feet on the rudder. There. Who says this ol' boy can't fly this ol' plane? Now I'm gonna make us some Old Fashioneds the old-fashioned way - the way dear old Dad used to!
Benjy Benjamin (Buddy Hackett): What if something happens?
Tyler Fitzgerald: What could happen to an Old Fashioned? – It’s a Mad, Mad, Mad, Mad World (1963)

I’m guessing some readers won’t remember this all-star, Oscar-winning classic. Indeed, it was made well before even my time, but I remember watching it on the ‘tube’ on more than one Sunday night in the late 1970s. I’d watch it with my Dad, who’d howl with laughter. I decided to watch it once again with my son. If you’ve never seen it, it’s worth the time. They just don’t make existential comedies like this one anymore. The story begins after a reckless driver named Smiler Grogan (Jimmy Durante) roarspast a handful of cars on a winding California road and ends up launching himself over a cliff. Before (literally) kicking the bucket, he cryptically tells the assembled drivers that he's buried a fortune in stolen loot… under a mysterious ‘Big W.’ He says: “350G’s. I’m givin’ it to ya’ but watch out for the bulls. They are everywhere.” Yes, they are, albeit he had a different sense in mind. [1] With little moral reservation, the motorists set out to find what they now consider their fortune.
The characters exemplify some of human nature’s best and worst qualities. At times, they are wildly creative and improvisational. However, they work together only to the extent necessary – double-crossing each other repeatedly. They lie. They cheat. They steal without a second thought.
They have a singular focus: treasure - at any cost. Their sense of entitlement is overwhelming. In the scene quoting Tyler Fitzgerald, who is a high-society alcoholic, two of the treasure seekers (played by Mickey Rooney and Buddy Hackett) convince him to fly them to Sant Rosita in a brand-new Beechcraft twin. Blinded by greed, they seem to care little that he is too drunk to stand. In the end, they all find the Big W together along with the treasure beneath - but only to be bamboozled out of it. Eventually, the money ends up being lost completely and redistributed from atop a fire escape to a crowd in ‘Santa Rosita square.’Helicopter money of sorts – easy come, easy go. Greed is not only their foremost motivation, but it’s their ultimate undoing.
There are more than a few similarities between the Mad, Mad, Mad, Mad World characters and today’s market participants. So far at least, myopic greed and speculation have paid well. Analysis has been a handicap. Unprecedented fiscal policy stimulus combined with the Fed’s debt monetization has thus far maintained a pretense of normalcy in markets. There will be consequences to ballooning balance sheets (both corporate and federal). Few seem to be considering that the ultimate consequence of massive deficits is at the very least potentially crushing taxation.[2] Or worse, if the Fed ever stops QE in an attempt to normalize policy by shrinking its balance sheet (soon to be an anachronistic concept), rates would likely rise steeply. The Fed is too busy bailing out the bottom of the boat to raise the sails.
Deficits are now so large that Treasury issuance monetization must occupy the vast majority of the Fed’s attention. This close the zero bound, the Fed can no longer significantly lower rates, it simply must prevent rate market dislocations due to massive supply. Fed action is no longer stimulative; rather, it is only palliative. [3] Importantly, it’s not Fed ‘liquidity’ feeding market participants’ emotional impulse. While it remains an enabler, it’s fiscal policy that is putting money directly into gamblers’ bank accounts. This distinction is crucial to whether fiscal policy continues to provide enough liquidity for a return to the casino later this year. [4] It seems that equity markets are priced for an aggressive second round of fiscal policy action, an efficacious vaccine by year end, and a healthy corporate America - free from defaults.
Takeaways
- The Fed that is now hamstrung – now ‘forced’ to monetize massive, and otherwise unsustainable, policy deficits [5]
- Fiscal policy stimulus has found its way directly into U.S. equity markets – particularly speculative names and technology. [6]
Pre-existing fragility – especially excessive leverage – will make escape velocity for markets and the economy particularly difficult to achieve.
- Liquidity will likely evaporate when personal and business defaults eventually sop up fiscal policy liquidity. The Fed is ill-positioned to act efficaciously. It’s too busy mopping up Treasury issuance.
- Loans create deposits and without creditworthy borrowers, even a continued, fiscal-policy driven expansion of M2 may not result in higher asset prices. [7]
- Risk-asset markets are not correctly pricing the coming explosion in prospective personal, corporate, and commercial real estate (CRE) defaults.
Liquidity Trap
Let’s start with the often-cited reason to be long equity markets now. As the story often goes:
“Take a look at the money supply. The Fed has printed money… so much money. Just look at the monetary base and M2. It has exploded. It’s bound to find its way into equities. Don’t fight the Fed.”
Old Fashioned, anyone? Proponents of this rationale may be right on the result (higher equities) for a time, but they’d be right for the wrong reason. This time is different. First, the Fed ‘printing money’ is an anachronistic phrase I wish well-paid strategists would stop using all together. The Fed’s creation of excess reserves (‘money printing’) and subsequent purchases of assets are no longer lowering interest rates sufficiently to stimulate real economic growth. Rates are already low. Its’s not the quantity of money that stimulates growth or increases inflation; it’s first and second order effects of lower capital costs – i.e. lower rates or yields. Now, the Fed’s reserve creation is solely for the purpose of preventing a rates market dislocation. After the GFC, the Fed lowered capital costs considerably; now, it’s simply treading water to keep them low. [8] Importantly, not only does this make it more difficult for the Fed to stimulate the economy, but it also makes it tough for the Fed to help prevent corporate loan defaults when cash flows deteriorate. Thus, the Fed’s direct impact on risk-asset markets has diminished greatly, and I’ll soon explain why it matters.
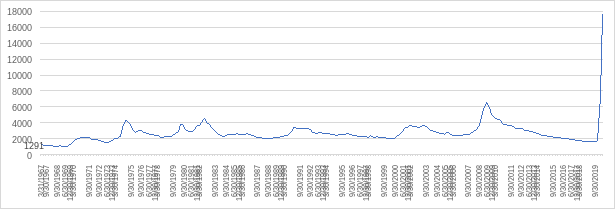
For one, it’s helpful to understand that the Fed has often implemented QE without a consequent outsized increase in M2, to which so many have pointed as supporting equities now. The connection is more complicated. Frist, risk assets have often rallied without any M2 increase. Contrary to popular belief, the more or less consistent growth in M2 (due to natural growth of currency in circulation as loans are made) generally sees spikes when there is aggressive fiscal policy response. As Figure 1 shows, the Fed’s balance sheet expansions (the asset side of the balance sheet identity for reserve liability creation) often do not correspond well with significant M2 increases. This is particularly clear during the $1 trillion 2013 quantitative easing program; money supply growth didn’t budge above trend. [9] In contrast, in both 2008, 2011and most recently, M2 did increase. Those instances accompanied fiscal policy stimulus, and in each case M2 increased in line with the amount of the fiscal stimulus. For obvious reasons, the impact of recent fiscal stimulus on M2 has been outsized.
Figure 1: Top Panel – M2 (blue) and Fed Balance Sheet (orange); Lower Panel – Change in M2 (blue bars); Source – Bloomberg Data
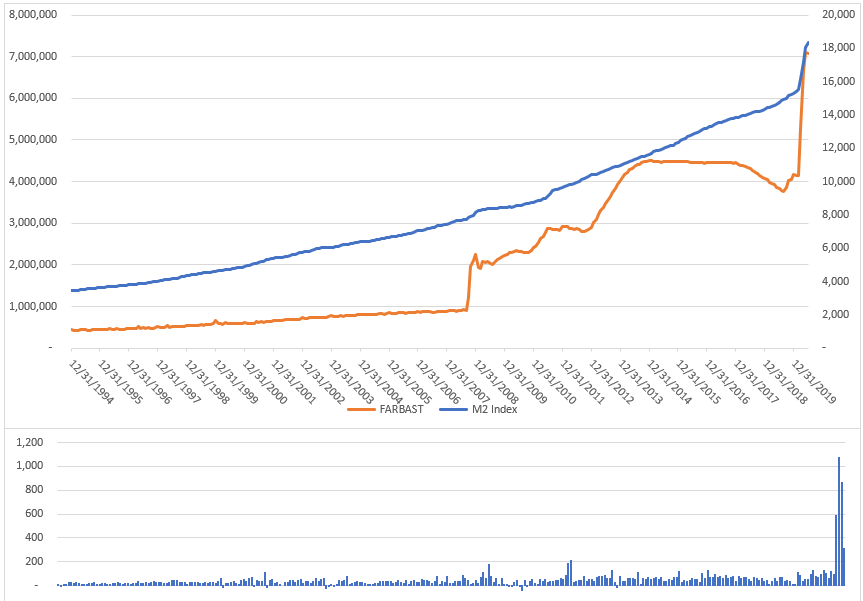
To cut to the chase, M2 growth is supporting equities, but it’s not a monetary policy phenomenon – it’s fiscal policy one. While fiscal policy is driving both investor sentiment and the beginnings of an economic recovery, the Fed still plays a critical role.Without its current “QE to infinity” approach, the massive supply of Treasuries would have little place to go. [10] Rates would likely move considerably higher, especially on the long end of the curve as demand would most certainly fall short of supply. Why? Precisely because of the massive policy deficits - already supersized even before the pandemic – required to combat the enormity of the pandemic shock. Fiscal policy is now the key – the Fed is the enabler but no longer the main actor.
Indeed, especially near the zero bound, low rates may lose their real-world stimulative efficacy. [11] A liquidity trap typically occurs when interest rates are low yet consumers and businesses tend to save. Indeed, since last year, I have advocated for gold (in part) because of this phenomenon. [12] Such behavior renders monetary policy ineffective. First described by economist John Maynard Keynes, during a liquidity trap, investors may choose to keep their funds in cash savings because they believe interest rates could soon rise, because they need to repair balance sheets, or because they wish to prepare for upcoming financial stress. At the same time, central bank efforts to spur economic activity are hampered as they are unable to lower interest rates sufficiently to incentivize corporations and consumers to invest or to consume, respectively. This is precisely why central bankers had been advocating for a fiscal policy response long before the pandemic shock. Ironically, because market participants no longer seem to perceive equities as a risky asset, saving appears to manifest vis-a-vis equity market speculation!
Fiscal Dominance [13]
So, what is next on the fiscal policy front? Well, it seems this stimulus round is shaping up more modestly than the initial round. Over $500 billion in paycheck protection (PPP) and another almost $300 billion in direct to consumer programs (includingsupplementary pandemic unemployment insurance relief) accounted for the lion’s share of a ~$1 trillion increase in M2 (Figure 1). [14] According to Bloomberg, after the White House dropped the idea of including a payroll tax cut, White House and Senate Republicans now have a “fundamental agreement” on a GOP plan for another round of pandemic relief. Instead of a payroll tax cut, the GOP will now back $1,200 checks for individuals who make up to $75,000 a year, just as in the March stimulus bill. Moreover, last week, Treasury Secretary Steven Mnuchin told CNBC that the Republican coronavirus relief plan will extend enhanced unemployment insurance “based on approximately 70% wage replacement. [15] ” Presumably, this will be something less that the current $600 for most Americans. In aggregate, the Republicans reportedly are ooking to propose $1 trillion in relief versus over $3 trillion from Democrats. The timetable for releasing legislative text, which is key to beginning negotiations with Democrats, is uncertain. One thing seems clear: the package’s scope will be more limited than the initial round of stimulus.
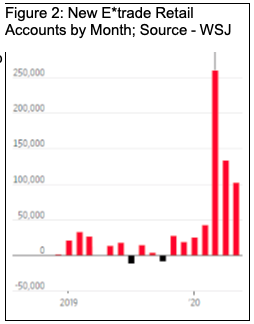
While likely smaller, the second round of fiscal policy response will once again put cash into checking accounts. This will once again help increase M2 and may also help to support equities. This is what’s so different about this equity market. With an assurance that the economy will be directly supported by more consumer directed stimulus, retail market participants are driving the rally – not unlike the late 1990s. [16] Just this weekend the WSJ put an exclamation point after the sentence. Figure 2 from the Journal shows the number of new E*Trade accounts retail investors opened in march. It dwarfs any previous month. It’s generally the same dynamic for the Robinhood platform about which I began writing in September of 2019. My favorite quote from the story is a woman who proclaims that her trading style is aggressive because ‘scared money makes no money.’ According to the Journal, “she read ‘Trading for Dummies,’ watched YouTube videos, opened an E*Trade account and dove in.” That sounds about right.
This is now the sixth month of a pandemic that has not yet significantly abated in the U.S. In order to continue unwaveringly towards the Big W, it would seem to require market participants believe an efficacious vaccine is not only assured but that it is also distributed quickly to the population. Moreover, there remains much unknown about the immune response and evidence is growing that immunity may be short-lived. [17] Nobody even seem to recall the slowdown that was already afoot before the pandemic occurred. [18] In light of an extended first wave of virus cases and with continuing unemployment claims still above 16 million, how much long might market participants throw caution to the wind? (Figure 3 illustrates just how enormous that unemployment statistic is.) Just how long will banks and investors continue to loan money based on a stimulus-based recovery thesis? The answer to the latter question is critical to not only asset prices but also to the main-street economy.
Figure 3: Continuing Jobless Claims Since 1967; Source – Bloomberg Data
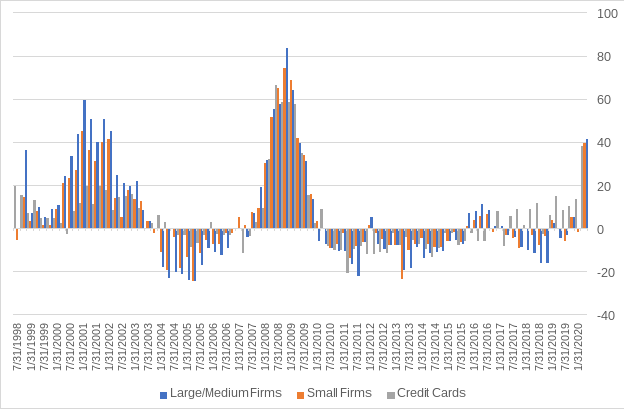
In the absence of unusual fiscal policy stimulus programs (as present) and under normal circumstances, loans create deposits. [19] Deposits, in turn, contribute to a capital base for yet more loans. Defaults and delinquencies are surely one thing that destroys the loan-deposit cycle. Defaults will slowly start to sop up liquidity – as they always do. Lending standards, which had already begun to tighten in 2019, are now tightening significantly… it’s likely just the beginning (Figure 4 above). [20] Corporate and consumer lending will continue to slow, and as the corporate sector begins to experience even more strain as leverage grows, speculative behavior should begin to dissipate. That’s when the narrative changes from ‘there’s so much liquidity out there’ to ‘what the heck happened to all the liquidity.’ Easy come, easy go.
Corporate sector leverage – particularly speculative grade loans and bonds – has been at the top of the list of concerns for at least the past twelve months. If it was a concern pre-pandemic, it is of far greater concern now – even taking into account the scope of fiscal and monetary policy action. Banks typically slow lending and non-bank lenders typically curtail funding when credit fundamentals begin to deteriorate. Policy action, especially fiscally funded support for performing corporate credit, has helped suspend lower-rated paper from wires above. While prices have rebounded, credit fundamentals are not improving. As Bloomberg’s Philip Brendel puts it:
“Distressed-debt supply fell by $3 billion in June to $195 billion, a 47% correction from the cycle's March peak of $366 billion. The stock market's rally, seemingly without a conscience, seems to be comforting credit markets as investors shrug off record Covid-19 cases and an upcoming parade of horrific 2Q earnings results. Yet sharp corrections are common in highly volatile distressed cycles, and we think the exuberance may mirror spring 2008's similar two-month window of calm, which didn't last.”
According to Bloomberg data and analysis, despite 26 issuers in North America already having become fallen angels as of June 30, about 47% of corporate debt carrying BBB tier ratings has either a negative outlook or is on credit watch negative. That’s about $2.6 trillion of BBB tier debt that carries a negative outlook or is on credit watch negative. This includes over $89 billion at risk of becoming high yield. Importantly, financials are the most at risk accounting for about 33% of the total (including issues from Intesa Sanpaolo, Discover Financial and Deutsche Bank).
Importantly, non-bank lenders and loan syndication vehicles are also challenged – specifically, collateralized loan obligation (CLO) and business development companies (BDCs). The CLO market is about $700 billion and supports the $1.2 trillion speculative grade loan market. BDCs account for over $200 billion of speculative grade loans outstanding. CLOs provide banks with a syndication mechanism, which helps them keep loans off their books and shifts the risk to third parties. BDCs on the other hand, originate loans and rely upon equity issuance to help fund loans. While best of breed BDC equities have rallied, second tier lenders have continued to struggle greatly. This will leave the smaller, capital constrained companies they were designed to serve without capital access. [21] As reported by Bloomberg, about 30% of CLOs are forecast to have tripped OC tests with some being able to trade their way out by selling the CCCs and buying BBs at a discount. [22] While playing defense, it’s difficult for CLO sponsors to promote new vehicles; thus, this important source of investor loan demand begins to evaporate. Credit expansion is an essential source of liquidity and M2 growth. It will be difficult for even extreme fiscal policy measures to supplant credit expansion indefinitely.
Conclusion
As I suggested in the Portnoy Top in early June, recklessness and bravado had become so extreme it seemed likely to have reached a crescendo that might correspond to a market top. Such extremes are indeed difficult to gauge – after all, what’s irrational can stay that way for some time. So far at least, the broader indices like the NYSE composite and the Russell 2000 appear to have topped on June 8th. Breadth has continued to narrow as a handful of large cap tech names are responsible for the advance in the S&P 500 ad Nasdaq. Technology shares have pushed even farther beyond the limits of rationality. [23] When over a third of the S&P 500’s market cap is large-cap tech, that is a bad sign for market health. Trading for Dummies should add a chapter on that. [24] Scared money may not make money today, but at least it lives to fight another day…The monetary policy guardrails upon which so many have come to rely are flimsy. Monetary policy is no longer providing the safety it once did. Why is that important? Because we must all now be focused on fiscal policy above all else when assessing near-term sentiment and market action. Even with fiscal policy support increasing money supply by direct deposit, a liquidity trap is likely. Perhaps even more ironically, for now at least, this trap is somehow supporting equities because of a new breed of reckless equity market participant, who regards the equity market as a form of saving. Ultimately, defaults and corporate distress will steamroll greedy bravado and force a reconnect of equity prices and economic reality. It’s happened once already this year. It will likely happen again. We don’t know for sure, but presumably Smiler was on his way the Big W when he went over the cliff. As he said, he spent twenty years earning every penny of that fortune, but he failed to live long enough to see it. Today, there’s notreasure under that Big W – it’s just a big ‘W.’ Live to fight another day, Smiler.
1 Bulls is apparently a German slang for police somewhere in between pig and cop.
2 Please see No Free Lunches.
3 The flaccidity of Fed action is but one reason I’ve been writing about the preexisting fragility in markets since this time last year. Others include excessive corporate leverage, weak corporate earnings (throughout 2019), and a slowdown in global growth that began in 2018. Moreover, the global trade war has continued. Please see The Art of War versus the Art of the Deal.
4 This presumes that most of the flow into equities is coming from retail investors. Please see my June 8th Check In entitled the Portnoy Top. The evidence keeps piling up that the marginal buyer is in fact retail. Please see: https://www.wsj.com/articles/everyones-a-day-trader-now-11595649609.
5 Without fiscal policy action (Treasury-funded SPVs) required under Section 13(3), the Fed could not ‘lend’ to corporations or support corporate bonds.
6 Recently, breadth has deteriorated considerably with broader indices like the Russell 2000 and the NYSE Composite failing to break above their June 8th local highs. Technology, a group particularly subject to retail sentiment, is at risk of any hiccup this earnings season with several large-cap tech names reporting at the end of July.
7 M2 consists of broad money supply which includes deposits.
8 Exacerbating the Fed’s predicament, with Treasury yields so close to zero across the entire Treasury curve, there’s massive convexity risk to a backup in yields.
9 Risk-asset markets rallied significantly because the Fed was focused on lowering yields on MBS, and that QE program purchased mostly MBS securities. This program had palpable economic impact through lower borrowing costs for homes. Recall that this program was announced in September 2012, and while focused on MBS, it also helped keep longer-dated yields down – that is, until the Fed announced a taper in June 2013. The 10-year yield rose quickly in expectation of taper and the Fed was ultimately forced (in September 2013) announce no taper would occur and the 10-year yield fell again throughout 2014.
10 The Treasuries market alone could see more than $1 trillion in net bond supply in the six months through Dec. 31. According to some Treasury analysts, sales may contain fewer bills and more, longer-dated notes. While many expect a further curve steepening, it seems more likely that the Fed will remain committed to keeping some steepness while controlling the overall level of longer-dated yields.
11 See Edward Koo’s work at http://im-an-economist.blogspot.com/2013/04/richard-koos-balance-sheet-recession.html
12 Aout three weeks ago, in an Aura of Treasure, I advocated for long gold and silver positions. The piece was picked up in Barron’s here:
13 Yes, it’s being used tongue in cheek here.
14 A company that received PPP funds faces the choice of paying employees on its own dime after the funds run out, or implementing the layoffs it put off for eight weeks and thus foregoing loan forgiveness. This choice is currently upon many companies.
15 According to Bloomberg, Republicans would cut unemployment benefits “to $200 weekly from $600 until states are able to create the system that would provide 70% of a laid-off worker’s previous pay up to the state-set cap.”
16 As the authors write, “it appears even bigger—and broader—this time around, amplified by digital communities on Twitter and Discord, a popular online chat hangout. Investors have transformed those social-media platforms into virtual trading desks, a place to swap tips, hype stocks and talk trash as they attempt to trade their way to a quick fortune.” https://www.wsj.com/articles/everyones-a-day-trader-now-11595649609
17 https://www.wsj.com/articles/a-big-unknown-in-covid-19-vaccine-development-how-long-will-protection-last-11595755802
18 cessive corporate leverage, weak corporate earnings (throughout 2019), an inverted yield curve with slowing loan growth, and weak global growth (beginning in 2018) were among the many signs.
19 The relationships of loans to deposits is a circular one, but deposits ‘funding loans’ is a fiction of bank’s balance sheets. Without loan growth, system deposits do not grow.
20 inverted yield curve beginning in early 2019 had already caused loan growth to slow, and it suggested a recession might be coming within 18-months.This had been my assessment then… alongside a steepener later in the year on early action by the Fed to cut rates.
21 e Main Street Lending program was fully launched July 6, but the Fed only started buying loans on July 15. Banks that make eligible loans to small- and mid-size businesses are able to sell 95% of each loan to the Fed. Loans can range in size from $250,000 to $300 million for an expansion of existing credit. It has done little to fill the BDC hole.
22 enerally speaking, CLO structures with more than 7.5% (higher in recent structures) of their loans falling into a CCC have to start refilling the over-collateralization basket (OC basket).
23 ‘Big tech’ (AMZN, AAPL, FB, GOOG, MSFT, NFLX) now comprise 38% of the S&P 500 (Bloomberg).
24 To be clear, I’m not ‘concerned’ for reckless retail investors, I’m simply making an observation that equity markets are reflecting the irrationality of their participants.


Subscribe to our evening newsletter to stay informed during these challenging times!!