Please Follow us on Gab, Minds, Telegram, Rumble, GETTR, Truth Social, Twitter
Guest post by Bill Broderick
Consider the tax issues and implications in Illinois:
Property tax: # 1 of 50 states
Gas tax: # 2 of 50 states
Commercial property tax: # 2 of 50 states
All taxes: # 7 of 50 states
Growth in home values since 2000 (13%): Last place of 50 states
Growth in Illinois economy last five years: 2.8%, # 46 versus national average of 10.8%
Growth in private sector jobs: past few years: # 49 of 50 states
Loss of businesses since 2021: # 3 of 50 states
And on the spending side:
Spending on public sector employees is 25% of state budget, highest percentile in USA
Spending per school student in Midwest: # 1
Pension debt of $142 Billion is three times larger than the annual state budget
The city of Chicago has a pension debt of $48 billion, a debt larger than the pension debt of 44 states
Taxpayer funding of Illegals: $1B for 2024
The implications for adverse impact on the lives of the people of Illinois include:
High taxes reduce spending opportunities for everyone, both people and businesses.
Potential for improving the quality of life is made more difficult when after tax income is less than what could be earned in other states.
Personal advancement in a career is hindered when job creation by employers is hobbled by a high tax environment.
The state of Illinois and the political class that is running everything is not operating in a vacuum. Here is one opinion on the need for change:

"High taxes in Illinois are severely impacting the citizens of Kane County. This financial burden stifles economic growth, hinders job creation, and reduces the quality of life. We need a responsible approach to fiscal management that lowers taxes and prioritizes the well-being of our community over unsustainable spending." - Lance Bell, Candidate for Kane County Board Chairman
---
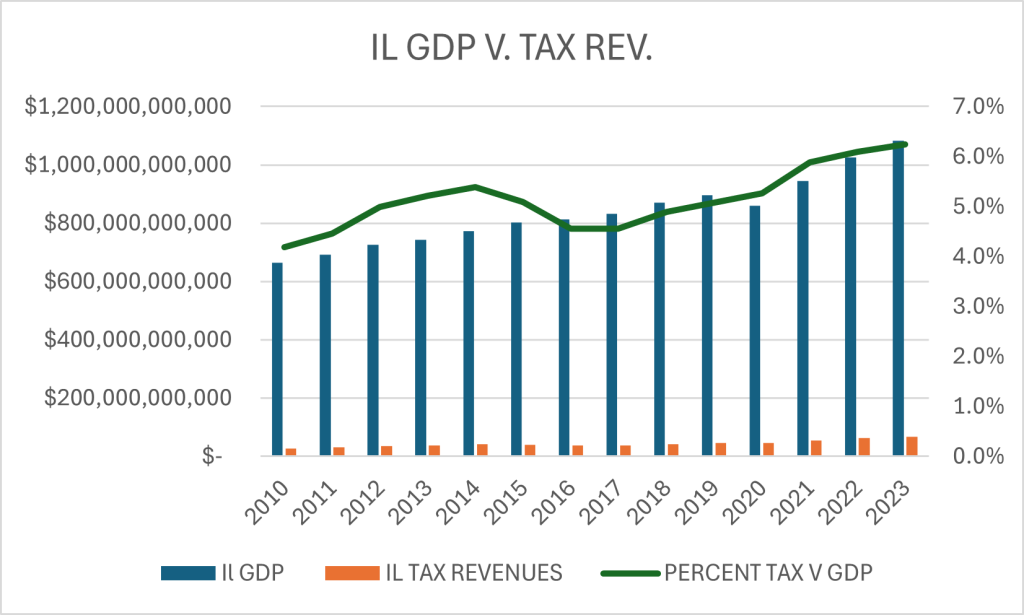
Here is a chart that outlines the annual GDP of Illinois from 2010 to last year, the tax revenues generated for each year and the percent share of taxes from the GDP. As noted, in 2016 the percent share of taxes versus IL GDP broke above 5% and has continued that trend every year. The most recent year of 2023, the share of GDP was 6.2%.
The politicians that run the state of Illinois are fully aware of the decline in state revenues over the past decade, given the loss of people and businesses. Their chosen solution has been to raise taxes, make up the shortfall and maintain spending at all costs, no matter how much debt or erosion of the state economy it causes.
For perspective, the national state level GDP versus state taxes is 5% of revenue. So Illinois has been trending above the national average since 2016, is 1.2% higher than the national average for the most recent year. This translates to approximately $6.7 Billion in excess tax collections in the most recent year.
The federal tax collection is 27.1% of national GDP. All levels of government are consuming about one third of the national economy. Amazing, eh?
We are left with more questions than answers. Where is the political leadership to reduce the costs of Illinois government, get spending in line with revenues, and give the people and businesses of our state the opportunities to thrive and prosper?
Bill Broderick
Note: All data cited for Illinois taxes and economy are derived from Wirepoints publication as well as other state based resources.
Subscribe to our evening newsletter to stay informed during these challenging times!!
No Schifftt ! Really ?