Please Follow us on Gab, Minds, Telegram, Rumble, Gab TV, GETTR, Truth Social
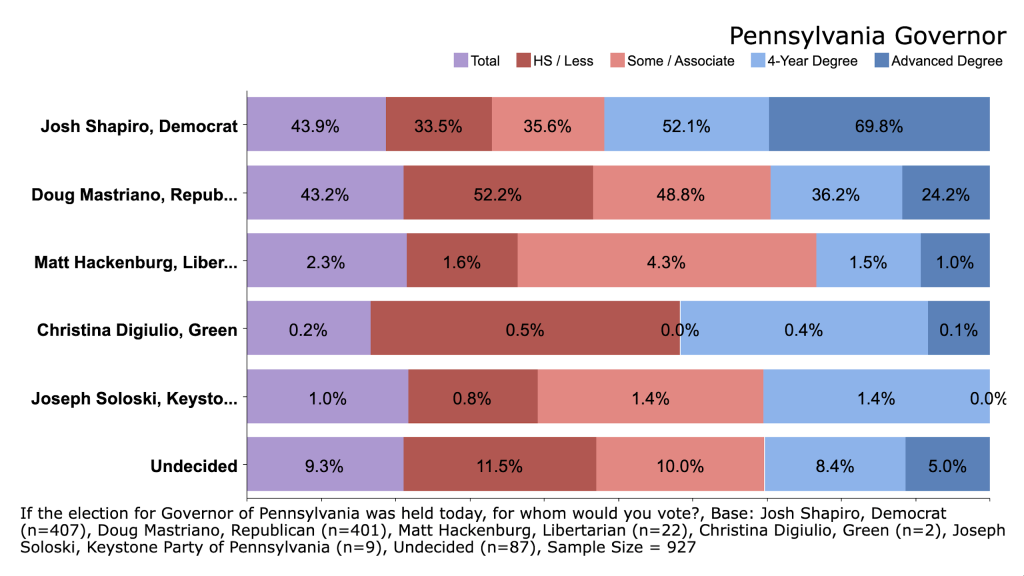
The CD Media Big Data Poll finds Democrat Josh Shapiro and Republican Doug Mastriano locked in a tight race for governor in Pennsylvania. Shapiro holds a statistically insignificant lead at 43.9% with Mastriano taking 43.2%.
The Keystone State is one of the most crucial battleground states and which party controls the governor's mansion is critical to the 2024 presidential election. The CD Media Big Data Poll was conducted before Donald Trump heads to Wilkes-Barre on Saturday to rally for both Mastriano and GOP Senate nominee Dr. Mehmet Oz.
Men back Mastriano 58.1% to 29.4%, while women back Shapiro by a 57.8 to 29.0 margin. By party, Shapiro takes 86% of Democrats against Mastriano, who takes 77.5% of Republicans and is leading significantly among independents, 47.4% to 30.2%.
By education, Mastriano leads among working class voters with no college degree 52.2% to 33.5% and among voters with some college or a 2-year degree, 48.8% to 35.6%. Shapiro leads among voters with a 4-year degree 52.1% to 36.2% and with advanced degrees, 69.8% to 24.2%.
As previously reported, Donald Trump now leads Joe Biden 46.6% to 40.0% in the state. The 45th President became the first Republican to carry the Keystone State since 1988 when he defeated Hillary Clinton in 2016, but lost it to the 46th President by less than 1.2% in 2020.
Only 20.8% strongly approve of the job Biden is doing as President in Pennsylvania, while 50.8% strongly disapprove and another 3.8% somewhat disapprove. Overall, he’s underwater 43.3% to 54.5%. Only a combined 28.6% of independents and third party voters approve.
Of those who are undecided in the race for governor, 61.9% strongly disapprove and another 4.4% somewhat disapprove.
The CD Media Big Data Poll for the Pennsylvania Midterm Elections was conducted by Big Data Poll and interviewed 927 likely general election midterm voters statewide via Peer-2-Peer SMS/OSP from August 30 to September 1, 2022. The overall survey sampling error is ± 3.2% at a 95% confidence interval. It’s important to note that sampling errors for subgroups are higher. Results are weighted to represent statewide voter file (Aristotle) demographics to include gender, age, race and ethnicity, education and region. The proprietary likely voter model is determined by both self-reported likelihood and vote history. The full crosstabs can be viewed on MarketSight and a detailed methodology statement can be viewed HERE.


